Wednesday, December 30, 2009

Best Map Books

The lovely Jonathan Crowe has been kind enough to place not one but TWO of my books in hisTop Ten of the Best Map Books of 2009 (http://www.mcwetboy.net/maproom/) but personally I agree with his choice of number 1, the brilliantly inspiring book of the best of the strangemaps website (http://strangemaps.wordpress.com/).

The Paris Underground book (http://www.amazon.com/Paris-Underground-Stations-Design-Metro/dp/0143116398) has been doing very well in the US and Canada in the run up to Christmas and one reason was the interest generated around Harry Becks attempt at making a London Underground-style diagram for the Paris Metro (both his versions of this published together for the first time in my book) and the subject of an article I put together for the leading UK design magazine 'Creative Review' (http://www.creativereview.co.uk/cr-blog). Since that article is no longer available on CR, I'm posting it here for the delectation of anyone who was unable to see it there before.

Why the French shunned a classic British design

By transport writer, Mark Ovenden

The Royal Mail commemorated of one of the UK’s greatest works of visual information design last month when Harry Beck’s London Underground diagram was included for the first time on a British Postage stamp (Fig. 1).

Fig. 1 The current London Underground map on a 2009 stamp. ©Royal Mail

The importance of Beck’s rectilinear, topologic 1933 diagram (Fig. 2) is widely recognised by graphic designers and much praised by “wayfinders” (people evolving the discipline of signage and mapping the urban environment) as one of the greatest works of the 20th century.

Fig. 2 Beck’s 1933 diagram ©TfL/London Transport Museum

Recent research though shows Beck was not the first person to iron out meanders in a waving rail line or colour lines in a system; he would have been inspired by other diagrammatic transport maps, by LNER draughtsman George Dow, individual line maps inside Underground trains, timetable maps and possibly a geometric representation of the Berlin S-Bahn, believed to pre-date Beck’s by a couple of years (Fig. 3).

Fig. 3 1931 Berlin S-Bahn diagram. ©BVG

Map collector Peter B. Lloyd says Beck built on what went before: “…going back to the Underground Group's first modern-looking maps of 1908”. Beck’s earliest sketches for the diagram published by London Transport in 1933 were first prepared during 1931 – the same date the Berlin S-Bahn plan was printed. Though it’s not possible to know whether Beck saw this, it is unlikely he was aware of it – a case perhaps of great minds think alike? Dow’s diagrams were however widely available from 1929 and it has been documented that Beck was aware of these.

Professor Maxwell Roberts draws on his impressive collection of pre-Beck railway diagrams, many emanating from the prolific Southern Railway’s timetables, and some dating to the 1890s when mainline railways across Europe were struggling to show their perplexing array of routes as directly as possible. A 1930 French Chemin du fer du Nord plan showed links to Belgium in a net of perpendicular lines. Going further back to 1897, The Gotthard Winter Season plan has only straight lines between the big cities (Fig. 4). And as Lloyd suggests: making a successful diagram is not simply a matter of straightening out lines: “The concept of a… closed system, as opposed to a map of all railway lines….the use of colour coding; abstracting the Underground from background topographical features; compression of outlying lines; the use of special symbols for interchanges - key elements of the visual language…were all invented [before Beck]

Fig. 4 Neat lines across Europe on an 1897 ‘diagram’.

Despite these forerunners, Beck’s contribution was impressive; the name of this electrical draughtsman has become an international byword for public transport schematics. His principles of neat 45 degree angles, elimination of topography and equalised station spacing have been emulated by urban rail map-makers from Atlanta to Zurich (as “Metro Maps of the World” showed). But the more interesting question is why Beck never extended his ideas outside London? The answer is he did. His attention was turned to the nearest major subway network to London: Paris.

Like London before Beck, the Paris Metro network had almost exclusively been represented geographically: maps outside stations were (and continue to be) highly detailed topographic plans of the entire city, showing virtually every road, park and waterway with the Metro lines superimposed in all their winding glory (Fig. 5).

Fig. 5 1930 topographic station wall map. ©RATP

Though a few examples of privately drawn diagrams have emerged (one Kandinsky-esque rhapsody in abstraction from 1939, so utterly bizarre and impractical that it was never repeated – Fig. 6 - plus a 1950s attempt by another British designer David Lawrence and several commercial offerings in the 1960s and 70s), schematics were not adopted by the RATP until the last years of the 20th century.

Fig. 6 Excessive geometry on pocket map issued by a private publisher. © All rights reserved.

According to Ken Garland’s excellent history (“Mr Beck’s Underground Map”) the Paris Metro operator approached Beck to design a diagram. Garland supposes the work was begun in the late 1930s but not finished until after the War. Garland shows that Beck included station name changes which happened after the War but left on some pre-War service patterns. Little survives of this first attempt except a lone monochrome copy in Garland’s collection (Fig. 7).

Fig 7. Beck’s first Paris Metro diagram, submitted but rejected just after WW2. The only surviving copy was in monochrome - this version has been coloured by Maxwell Roberts.Composite image by kind permission Ken Garland/Capital Transport/Max Roberts

The Paris Metro is not as easy to simplify as the London Underground. Firstly the lines interweave with each other more (Ligne 7 the snakiest of these customers); this gives rise to more interchanges (by 1933 around 40 in London, 50 in Paris, depending on what one defines as a proper interchange between lines). Also the system was then mostly hemmed-in by the old Paris walls (a distance equivalent east-west to the width between South Kensington and Canary Wharf and north-south between Camden and Brixton). With 200 plus stations in easy reach, this is great for passengers, but more challenging for map-makers! One of Beck’s greatest innovations was to massively expand inner London and condense the outer suburbs. This was just not needed in Paris (at that time) because the entire system was already in the ‘centre’ and very few stations in the suburbs.

Given he had an entirely free hand, and standing on the shoulders of his own and other people’s diagrams, what Beck therefore tried for Paris was in some ways more radical than what he’d achieved for London. He sought in the mass of interlinked lines some key visual axes to give his diagram order. Seizing the east-west running Ligne 1, Beck made it his prime axis (not as in London’s Central Line, running horizontally, but at that neat angle of 45 degrees). He exploited something seen unnoticed by previous cartographers: Lines 2 and 6 form a rudimentary circle. Beck transformed them into a rectangle with rounded edges. From these roots he plotted the other lines as straight as possible with impressive results: the curvaceous Ligne 10 becomes a flat line with its odd one-way loop stylised at extreme left. Kinky Ligne 14 is straightened to a single stroke. Ligne 3 – often seen on other maps with up to 11 direction changes – is reduced to just one nicely rounded alteration.

The overall appearance is clear, balanced and arguably easier to follow. However the key question was: would the French like it? The answer when Beck presented his first version was a resounding “NON!” Beck was not easily deterred. Indeed his first London diagram was also rejected but he persisted and eventually its adoption, adoration and appositeness for the Underground was widely applauded. The same fate was not to befall Paris.


Fig. 8 Beck’s 1951 revision including the River Seine. By kind permission London Transport Museum.

Beck went back to his drawing board and produced a second version (dated as 1951, Fig. 8). It’s not known if this was commissioned but luckily for us it survives in full colour and was recently revealed as one of the attractions at the refurbished London Transport Museum. It was published for the first time in a book when “Paris Metro Style in map and station design” came out in November 2008. Like any inspired genius, Beck did not waver from his initial concept: here again were his two original axes but Ligne 4 is simplified in its northern half. There are 15 physical direction changes in Ligne 7 heading towards almost every compass point; Beck whittled these down to just two. Ligne 8’s 14 real bends come down to two, Ligne 11’s 8 real turns cut to none….and more visually impacting, Beck has with great wit added the River Seine.

So why did the Paris Metro – now operated by the RATP – reject Beck’s clear simplification of their beloved system? One reason is visible at each station entrance; Parisians use the maps here as a free public service to help them find their way round the city – the ubiquitous geographic wall map is more than just a Metro plan. The French adore pure cartography – laying claim to many mapping firsts, not least of which were colonial maps of the newly discovered lands in North America and Cassinni’s magnificent Carte géométrique de la France– a topographic map of the entire country (begun in the 1670s, though not finished until a century later). The painstakingly precise 1739 Turgot map of Paris (a kind of 3D view from the air, purported to show every visible window) is legendary.

Aside from cartographic history though, Roberts argues there was a fundamental problem with Beck’s Ligne 1 axis: “Paris is on a slant. Line 1 especially…at roughly 25 degrees to horizontal. For a traditional diagrammatic map, which angle should it be snapped to? Horizontal or 45 degrees? Whatever angle [is chosen, results in] at least one of the following problems: (1) uneven use of space as lines are compressed together or stretched apart more than in reality; (2) lots of kinks for trajectory correction to avoid (1); or (3) lots of geographical distortion”.Roberts suggests Beck’s omissions on both versions (Gare de Lyon missing and Montparnasse drawn wrong on the first and both Edgar Quinet and Vavin stations missing on the 1951 version), led to suspicion that the concept was untrustworthy. Though many contemporary Paris Metro maps also contained errors, some going uncorrected for years. In his fascinating critique of Beck’s work (at www.tubemapcentral.com) Roberts postulates powerfully that though Beck’s diagram has aesthetic qualities it distorted well-known Parisian geography too much for comfort. This is a city which took its twenty arrondissements to heart far deeper than Londoners ever appreciated their postcodes or boroughs.

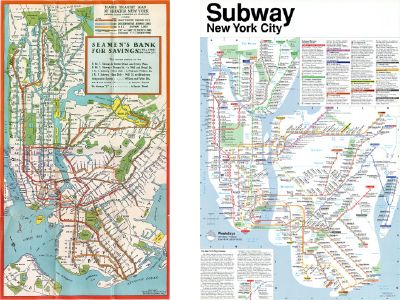
Also diminishing a diagram’s benefits are the closeness of the stations to each other; one can be plonked down blindfolded in virtually any Paris quarter, walk 500m in any direction and theoretically bump into a Metro entrance. Although in practice there are several holes in the system, such station spacing is much denser than in any other city in the world; a feat the French are justifiably proud of. But pride may be the true reason for the operators’ disinclination towards Beck’s or anyone else’s diagrams. By mid century Beck’s London diagram was ubiquitous and it was beginning to catch on: Sydney’s rail network was depicted in Beck style from 1939 (when a pocket map was issued on an identical sized folded card even aping the London Underground roundel on the cover). New York had its first Beck-esque diagram by 1958, Boston by 1967, Moscow & Osaka: 1970, Saint Petersburg: 1971, Hamburg, Munich and Tokyo: 1972, Melbourne, Montreal & Glasgow: 1976….etc

Fig. 9 Sydney’s mainline rail system depicted in a 1939 card folder – beside a contemporary London offering. By kind permission London Transport Museum

In staunchly proud Paris, despite the multi-coloured spaghetti with which most contemporary maps had portrayed the Metro, there was opposition to following Britain too closely. Double-decker buses for instance – though tried out in the 1960s – were not thought suitable for the Paris streets at least partially because they resembled too closely the ambiance of the British streetscape. In addition, a 1934 pocket Metro map by F. Lagoute, introduced a style that essentially lasted almost forty years: though it fell short of standardising angles and was occasionally redrawn, its clarity and geographical reflection of the city was sufficient for Parisians not to complain – a behaviour which they normally have few qualms in partaking (Fig.10).

Fig. 10 A 1936 version of the ‘Lagoute’ pocket map with coloured lines, little topography and some straightening. © RATP

Such dedication to home-grown products is highly commendable but ultimately the overwhelming practicality of the diagram has won over. During the 1980s the RATP experimented with pocket maps; these were drawn by Patrice Rouxel who admits to having been inspired by Beck, but who never saw his versions of Paris from thirty years earlier.Rouxel’s efforts veered from wild distortion to light tinkering with the concept of line straightening, equal station spacing and a degree of abstraction which were permitted by his bosses and to which Parisians have slowly adapted. In 1999 on the eve of a new century and mindful of Paris’s prominent position as the most visited city on the planet, the forward thinking head of RATP’s design department, Yo Kaminagai, and his lead map designers culminated a quiet cartographic revolution: they commissioned a diagram. The resulting design from independent agency BDC Conseil (Fig. 11), adheres so rigidly to Beck’s rules that he would surely have been honoured by it, and though there are now almost twice as many lines (Ligne 14, tramways and five RER lines) the current pocket map has become accepted a part of French life as a Beck-esque diagram is for virtually every other city.


Fig 11. Two versions of the contemporary Paris Metro diagram. The landscape version is less common, the square variety is in all pocket maps and inside the trains. © RATP

There was just one idiosyncrasy: the geographic maps were retained as large wall posters at station entrances and on platforms. Yet even this hegemony for true geography was finally toppled in 2008 by the introduction of a diagram for the Île-de-France regions’ rail services (Fig.12), becoming the first truly diagrammatic station wall poster. Complete with 45 degree angles and distortion of some gaps and distances, one cannot help imagining that Harry Beck who died in 1974, would have cracked a wry smile.


Fig. 12 The Paris region’s rail services as a single diagram. © RATP

· Becks 1951 diagram has been redrawn by Max Roberts who has re-coloured it to match the line colours used on official maps of the day. It’s available as a poster from www.afterbeck.com

Further reading:

· “Paris Metro Style in Map and Station Design”. Mark Ovenden. ISBN 1-85414-322-0 (reviewed in CR January 2009)

· “Pari Underground - The Maps, Stations and Design of the Metro". Mark Ovenden. ISBN 01-4311-6398

· “Mr Beck's Underground Map”. Ken Garland. ISBN 1-85414-168-6.

· “Underground maps after Beck”. Max Roberts. ISBN 1-85414-286-0

· “Metro Maps of the World”. Mark Ovenden. ISBN 1-85414-288-7

· “Telling the passenger where to get off”. Andrew Dow ISBN 1-85414-291-7

· “No need to ask”. David Leboff and Tim Demuth. ISBN 1-85414- 215-3

Monday, December 14, 2009

The French Connection in New York Subway Mapping

Here's an Op-Ed which I wrote after a research trip to New York. It was first published in November 2009 here Mark Ovenden: The French (Re-)Connection by the excellent Map Room site.

THE FRENCH RE-CONNECTION

There’s nothing more likely to fire up a native New Yorker than the state of the Subway — you hear it talked over in delis and corner shops and on television, and one of the juiciest debates starts up when it comes to the map of the Subway. There are those who recall the baroque beauty of the Hagstrom maps of the 1930s to 1950s which they held on to when racing out to Coney Island as kids. Others, whose heyday was the late fifties, will recall the clinical clarity of the Salomon diagram map.

New York subway mapsBut, ever since a design contest in 1964 — one of the winners being the dashing young lawyer Raleigh D’Adamo — the controversy over how the 772 miles of subway lines and countless service permutations are presented to riders has raged sporadically. Things came to a head when world-renowned Italian designer Massimo Vignelli presented his re-working of the map in an artist’s palette of bright colors and neat forty-five-degree diagonals. This was published in 1972. Many graphic design buffs and visitors found it superbly stylish and, like Salomon’s 1958 map, comparable in clarity to the London Underground diagram designed by Harry Beck in 1933.

But many others found the abstraction made the map difficult to use. In 1975, theTransit Authority set up a Subway Map Committee, chaired for most of its three years by John Tauranac — which labored to re-design the map and incorporate into it the staggering quantity of detailed service information that New Yorkers need to use their Subway. Under the direction of the Committee, Michael Hertz Associates put together a map that combined the beautifully flowing lines of artist Nobuyuki Siraisi with the dense assemblage of service data. This completely new map was published in 1979. It’s been the key to the way New Yorkers look at the city beneath their feet for the last thirty years.

Vignelli (who in the meantime had been called upon by the RATP for a major new design project on the RER system), was understandably dismayed by the Transit Authority’s decision to abandon his schematic in favor of a much more geographic approach and the differences of opinion famously surfaced at a public debate in Cooper Union Great Hall in July 1978. Since that date, none of the main protagonists have been in the same room together until last Saturday. It was a love of transportation cartography that brought Vignelli, D’Adamo, and Tauranac under one roof — appropriately at New York’s atmospheric Transit Museum. They all came for a talk on mapping the Paris Métro. This was a peculiarly pertinent occasion, as Vignelli himself designed the regional transportation map of Paris in the 1990s, which in turn pushed the actual Métro map into a more diagrammatic direction. Nor was the Paris Métro unfamiliar to Tauranac, who once designed a map of the Métro — executed, like the 1979 New York map, by Michael Hertz, but never published.

The recent elevation of interest in the complex skill of transit cartography — especially since the publication of the first global book on the subject (Transit Maps of the World, Penguin, 2007) — seems to have forged some unity among both professionals and amateurs alike. But New York has the most complex subway system in the world, and no single map will ever capture all its nuances in a form that will satisfy all its riders. So there’s little chance that the talented minds in New York Subway map design — Vignelli, Tauranac, D’Adamo, Hertz, Siraisi — will ever agree with each other on a single all-purpose design. But the good news is that now the maps and the mechanics of making them is so much more in the public eye, that there is growing respect for each man’s work.

This was clear at another meeting a few days later — in the Mid-Manhattan Branch of the New York Public Library on Tuesday, October 27 (the 105th anniversary of the opening of the Subway). Around 130 people turned up to listen to a talk by John Tauranac on the history of mapping the New York Subway. John gave a thorough background to the story of how the city’s system has been presented to the public but saved the crux of his thoughts for the comparison between how each mapmaker has solved one particularly thorny issue: the Bleecker Street interchange from Line 6 to the B, D, F and V (at Broadway Lafayette) — or more accurately the complexity of it. Bleecker Street is odd because it is possible to transfer onto the other lines from the 6 on the downtown bound platform only. You just can’t do it from the uptown bound side. Tauranac — who describes himself as “a guide” — sees this level of information as crucial to using the system. It was from this perspective of demanding complete accuracy over station placing that he first took exception to Vignelli’s 1972 diagram. “No matter how aesthetically pleasing the thing was to look at,” he told the capacity crowd at the Library, “some stations were just in the wrong place.” Indeed, John saved his strongest criticism for Vignelli’s widely acclaimed 2008 revision of the famous diagram because, despite many improvements, the Bleecker Street transfer was still shown incorrectly. “On Vignelli’s new diagram it looks like the transfer is possible only in the uptown direction — but of course it’s the other way round!” lamented John.

Tauranac's New York Subway MapA visit a few days earlier to Tauranac's apartment had uncovered a wealth of historical material on the evolution of the 1979 map - plus a big surprise: John, a keen Francophile, had even attempted to spread the 1979 New York Subway map style to the Paris Metro - a small sample of which was tucked away in the corner of his office. Tauranac has designed a wide range of cartographic products for the city, incorporating what he regards as the best practice, but almost exclusively based on real geography — “parks are green and water is blue,” he explained to the gathered mass squashed into the library’s presentation room — as if one of us might dare leave thinking otherwise. But he’d reminded us earlier of one rather prophetic comment that arose during that Cooper Union debate: “Why don’t you just have two maps — one geographic the other schematic?” said one bright spark. As John came to his conclusions he unfolded his latest Subway map: “I’ve finally bitten the bullet,” he reveals to the dumbstruck crowd: “I’ve put a geographic map on one side and a schematic on the other.”

This coincidentally is the solution they’ve also adopted in Paris, where despite several early attempts to neaten up all those unruly interweaving lines, the Métro operator, the RATP, had long preferred a more Parisian feel (essentially quite accurately geographic). But in 2000 even they relented and provided passengers with a schematic network map inside the cars (and as a tiny pocket map also) and they have left the handy but strictly geographic map at station entrances and on platform walls — a very definite concession to the fact that any big transit operation is easier to navigate with the two-pronged approach of providing maps of both types.

Postscript

After the event at the Library, I make my way back to 23rd and 7th in the rain. I unravel the large MTA Subway map to find where I am relative to the station. It works. Bless that trusty thirty-year-old design! When I get to Times Square it’s the usual labyrinth full of chaos but I jump onto a 2 train only to realize I’m not actually sure the train will stop at 23rd. I’m unfolding the MTA Subway map again to double check. The large piece of frequently folded paper is damp and unwieldy in the crowded train. It opens rather unhelpfully at the other end of Long Island and as I trying to refold it to the appropriate section of Manhattan whilst clinging onto a strap to stop myself toppling over, I knock into a fellow passenger who scowls knowingly at the stupid tourist. A part of the paper drops off along the oft-folded crease and lands on the wet, dirty floor, but the doors have already opened at 34 St Penn Station and I’m not sure whether to change here onto the Local or wait ’till the next stop or even if this train stops at 23rd anyway. This is precisely where a small simple diagram would clearly have been jolly handy and as the doors close I realize I’m stuck on a Express which will zoom past 28th. Curses! The words of John’s talk are racing round my head as my stop at 23rd whizzes past at speed, and I’m frantically trying to reassemble the sodden mass before I get any further downtown.

But the scowler is a secret angel and recognizing my plight has fished out his iPhone and brought up an application (or “app”) which is a surprisingly clear answer to my needs. It’s the KickMap of the Subway, designed by Eddie Jabbour — a hybrid of a schematic with lots of surface geographic features. I thank the kind gentleman, making a note to download said app at the earliest opportunity, and get off at 14th to go back two stops on the nice Local. And I praise the cartographic equivalent of light at the end of the tunnel!

WELCOME

Welcome to this new blog about maps, metro's, cartography, transport and a handful of other nonsense (probably mostly including 'grumpy old man' style rants about mobile phone operators or banks rip-off charges!)